What does it do?
I have my Raspberry Pi setup to read the values from my SMA 1600TL inverter and post them to PVOutput.org.
Now, PVOutput.org creates really nice graphs, but I also want to have something like a daily report/graph without having to print/create one from the site by hand.
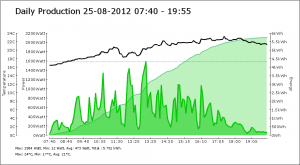
So, I created a script that creates a daily graph, using the data in the MySQL database (no need to get from PVOutput what we already got) and then mails that to me. I have setup a cronjob so it happens every evening at 9PM. I documented the setup on this page. However, there was still one thing missing. My graphs didn’t have the temperature information in them that my PVOutput.org graphs have. So, I changed that.
NOTE! Getting this to work requires all the version 1 setup and it requires that you have setup PVOutput.org to retrieve temperatures!!
Setup PVOutput.org to retrieve temperatures
 Even if you don’t have your own weather station at home, you can have temperature data stored alongside the data of your inverter at PVOutput. You can tell PVOutput to get the data you need from another online service called Wunderground.
To be able to do that though, you need to get a (free) Weather API Key.
Go to this page: http://www.wunderground.com/weather/api/
Enter your details and create an account. You need a free developer account. It allows for < 500 API calls per day. That should be enough for a single inverter requesting data every 5 minutes. If you have more than one inverter on pvoutput.org you need to lower the update frequency to stay under that 500 API calls.
Goto the details page for you inverter at PVOutput.org and choose “Weather” as Primary Device. Enter the API key there and a Temperature Unit. Also enter the code for a weather station close to your inverter. Use the “FIND STATION” link to find one. Once you have done that, PVOutput will display temperature data in your live graphs:

You are now ready to have that data added to your own reports.
Setup version 1 of the script
Now you may or may not already have setup version 1 of the scripts. Since that takes the most time, I am not going to repeat that setup here, but assume you have done so.
If not: Setup version 1 of the script first by following these instructions!
DO NOT PROCEED IF YOU HAVE NOT SETUP VERSION 1 FIRST
Connect via Putty
In Putty:
# sudo bash

# cd /var/www/smareport

# mv index.php index.php.old

# mv mail_report mail_report.old

# wget http://ictoblog.nl/files/raspberrypi/smareportv2/index.txt

# mv index.txt index.php

# wget http://ictoblog.nl/files/raspberrypi/smareportv2/config.txt

# mv config.txt config.php
Edit config.php to add your info:
#nano config.phpNow proceed with the rest of the setup:
# wget http://ictoblog.nl/files/raspberrypi/smareportv2/import_pvoutput.txt

# mv import_pvoutput.txt import_pvoutput.php

# wget http://ictoblog.nl/files/raspberrypi/smareportv2/mail_report

# chmod 0754 mail_report

# wget http://ictoblog.nl/files/raspberrypi/smareportv2/pvoutput.sql

# mysql -use smatool -u root -p < pvoutput.sql

(enter the password when prompted for it)
Done.
The sql-script creates a new table in the smatool database. I choose not to edit the existing DayData table, but to add a table alongside just to make sure I don’t rely on DayData to stay the same.
The mail_report script now calls the import_output.php file once a day just before it runs the index.php that creates the image and mails it to you. You had already setup the cronjob for version 1, that does not change with this version.
